Reading a Graph
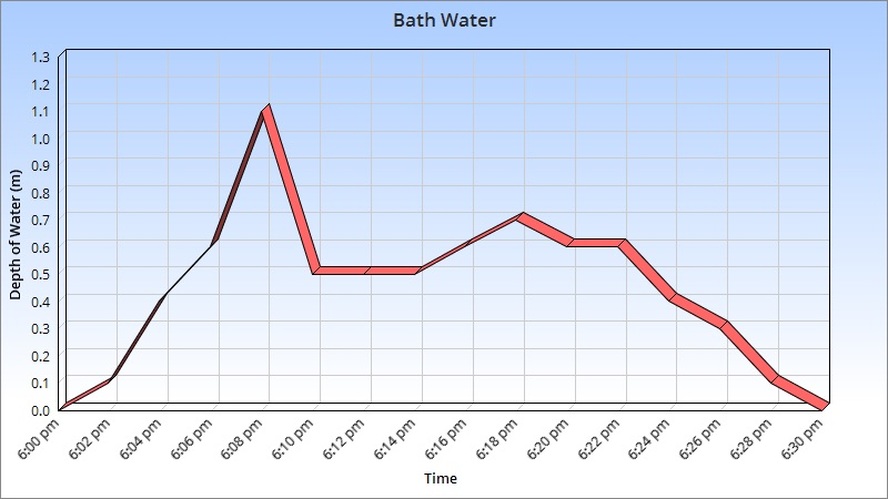
This is a graph of water in a bath.
Your task is to write an imaginative story using data from the graph to support your plot.
Ask your teacher if you do not understand what is occurring in the graph.
Use Microsoft word to compose your story and save it in your class folder.
(If you are curious - I made the graph in Chartgo which is in the orange section of the Symbaloo data page below.)
Wondering what to do next?
On the Symbaloo Data page below Investigate graphs (red). I recommend The Jellybean Tree. Ten move on to Interactive Graphs (teal). I recommend Frequency Diagrams, and Jewel Diver.
On the Symbaloo Data page below Investigate graphs (red). I recommend The Jellybean Tree. Ten move on to Interactive Graphs (teal). I recommend Frequency Diagrams, and Jewel Diver.
