Investigating Graphs
If you did not full explore "Welcome to Graph Investigator" when we made graphs, please do it now.
This task is designed for you to demonstrate your ability to read, interpret and assimilate information presented into graphs and tables. The four diagrams show different aspects of a student’s typical Saturday. You are to write a story that meshes together some of the important details. You can choose to write in form of a diary or narrative (first or third person). The fifth possible task uses graphs on the internet and you are required to write a persuasive text.
Some questions you could consider:
“What does typical mean?”
“What is the value of the whole circle in a pie graph?”
“What is the category ‘Other’? Why do we need it?”
“What features do you notice in the Bar graph, dot plot….?”
“What features do all graphs have in common?”
“Which graph contains the main information you will need for your story?”
“How can you use the information in the other three graphs?”
“Do you need to put all the information shown in the graphs into your story?”
Choose one of the five tasks to complete.
Task A
When data is collected it is organised into tables and graphs so that any patterns or trends can be quickly identified. The following tables and graphs relate to the activities of a student on one typical Saturday.
Use this set of graphs as the basis to write a story about how the student spends the Saturday. The student can be you or someone completely made up. You must use the information from all of the graphs and tables. Everything you write must be accurate and based on these facts, however you need to make your story as interesting as possible. You can write it as a diary or a narrative.
If you see a graph you do not understand ask the teacher.
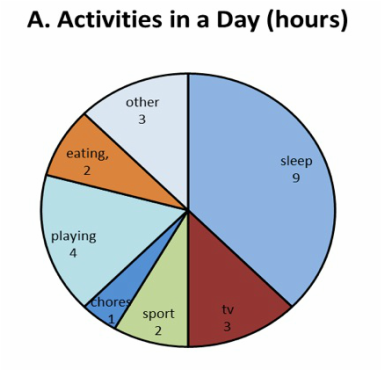
Pie graph
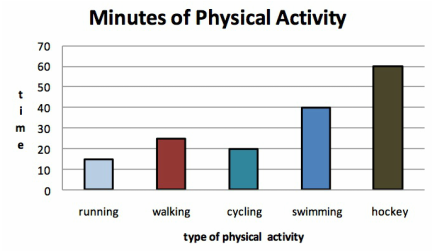
Bar graph
|
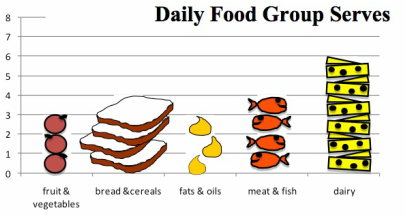
Pictograph
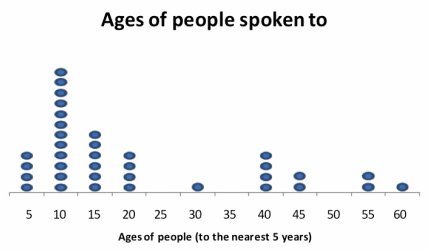
Dot graph
|
Task B
When data is collected it is organised into tables and graphs so that any patterns or trends can be quickly identified. The following tables and graphs relate to the activities of a student on one typical Saturday.
Use this set of graphs as the basis to write a story about how the student spends the Saturday. The student can be you or someone completely made up. You must use the information from all of the graphs and tables. Everything you write must be accurate and based on these facts, however you need to make your story as interesting as possible. You can write it as a diary or a narrative.
If you see a graph you do not understand ask the teacher.
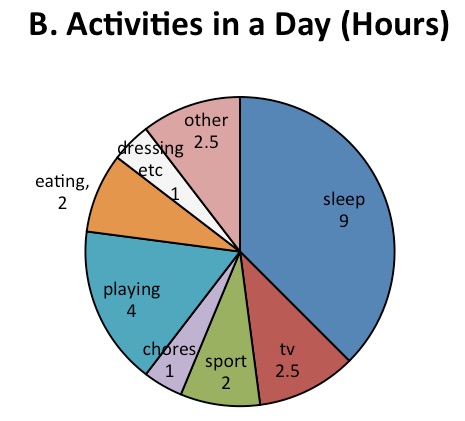
Pie graph
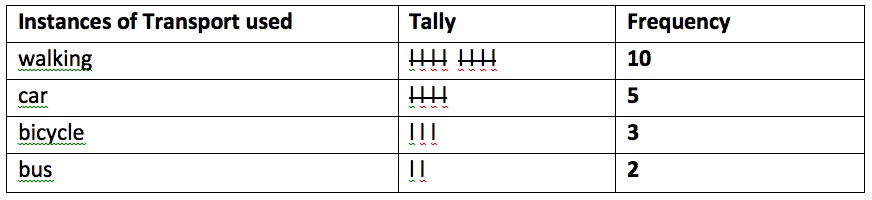
Frequency table
|
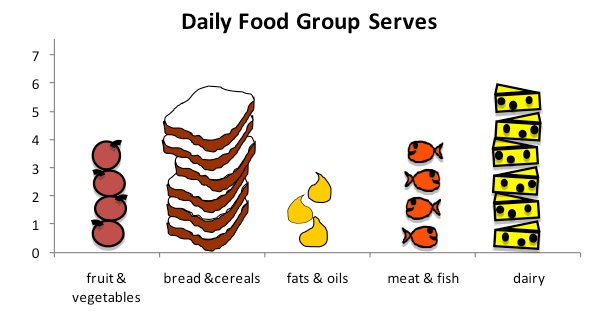
Pictograph
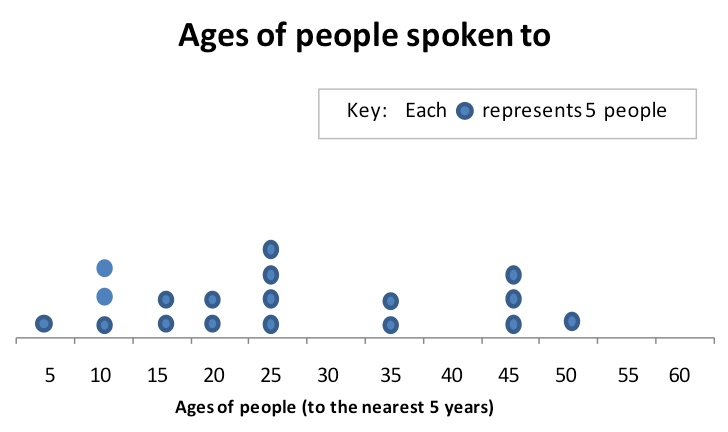
Dot plot
|
Task C
When data is collected it is organised into tables and graphs so that any patterns or trends can be quickly identified. The following tables and graphs relate to the activities of a student on one typical Saturday.
Use this set of graphs as the basis to write a story about how the student spends the Saturday. The student can be you or someone completely made up. You must use the information from all of the graphs and tables. Everything you write must be accurate and based on these facts, however you need to make your story as interesting as possible. You can write it as a diary or a narrative.
If you see a graph you do not understand ask the teacher.
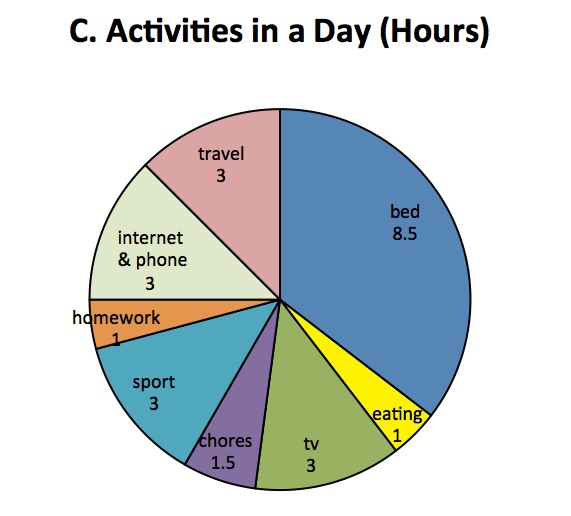
Pie graph
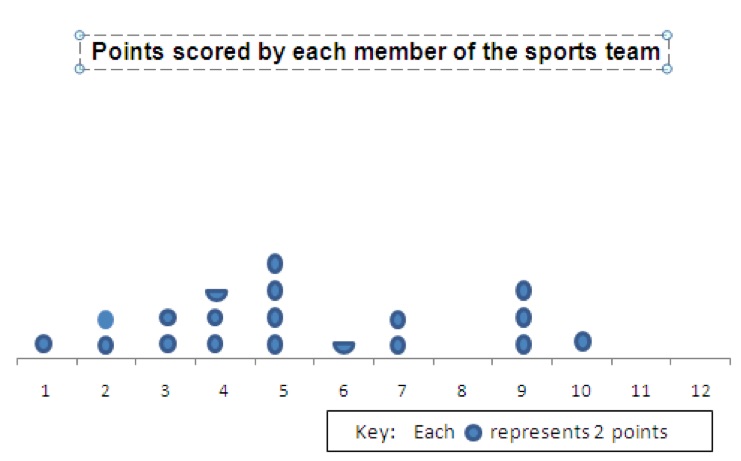
Dot plot
|
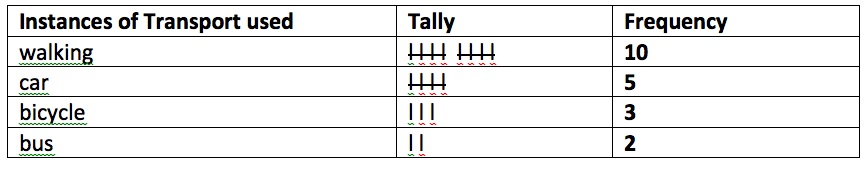
Frequency table
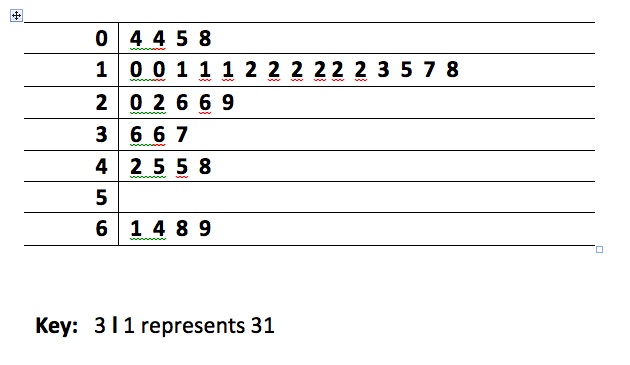
Stem and leaf plot of ages of people spoken to in a day
|
Task D
When data is collected it is organised into tables and graphs so that any patterns or trends can be quickly identified. The following tables and graphs relate to the activities of a student on one typical Saturday.
Use this set of graphs as the basis to write a story about how the student spends the Saturday. The student can be you or someone completely made up. You must use the information from all of the graphs and tables. Everything you write must be accurate and based on these facts, however you need to make your story as interesting as possible. You can write it as a diary or a narrative.
If you see a graph you do not understand ask the teacher.
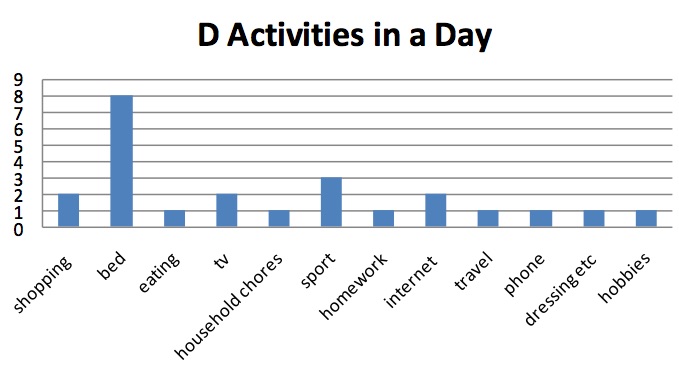
Bar graph
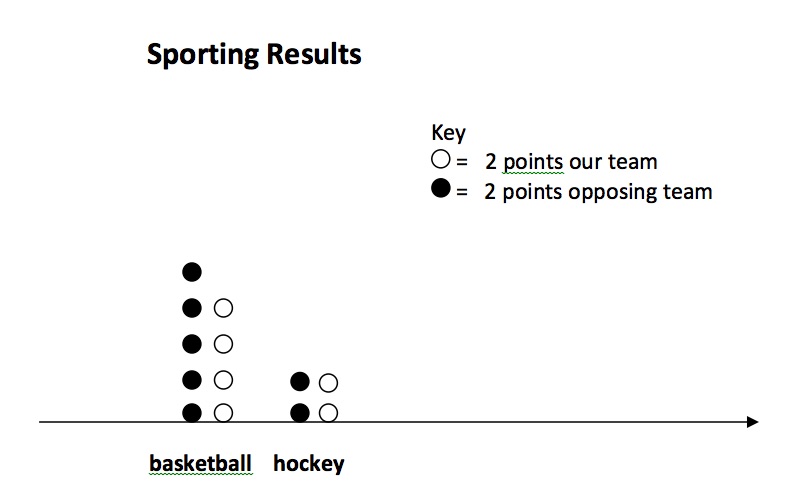
Parallel Dot plots
|
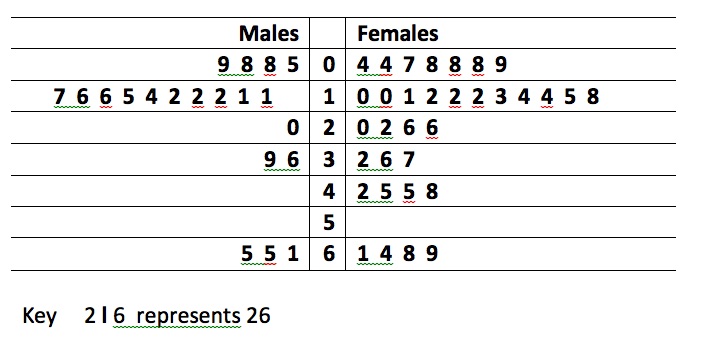
Back to Back Stem & Leaf Plots of ages of people spoken to
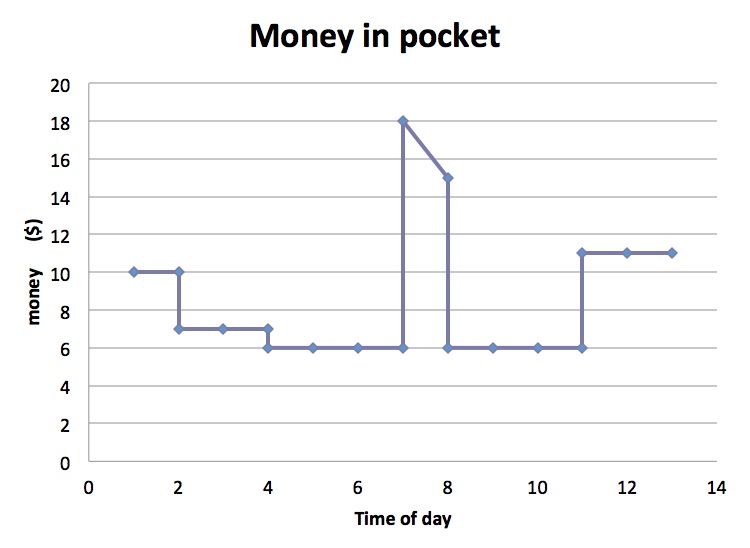
Money against time Line graph
|
Task E
Write a persuasive text to support your view of climate trends in Australia with a particular focus on Sydney. Use information in the graphs to form and support your ideas.
Write a persuasive text to support your view of climate trends in Australia with a particular focus on Sydney. Use information in the graphs to form and support your ideas.
Climate change and Variability
Australian climate Trends
Both of these sites focus on Australia and are government sites. They have many graphs for you to search and understand.
Australian climate Trends
Both of these sites focus on Australia and are government sites. They have many graphs for you to search and understand.
How to Mark
Download the rubric. Print one copy for the teacher and one for yourself.
Look carefully at your work and read it as though you are reading it for the first time.
Download the rubric. Print one copy for the teacher and one for yourself.
Look carefully at your work and read it as though you are reading it for the first time.
| s3_rubric_investigating_graphs.docx |
